Table of Contents
How Customer Analytics for Restaurants Can Boost Revenue in 2026
Quick Answer
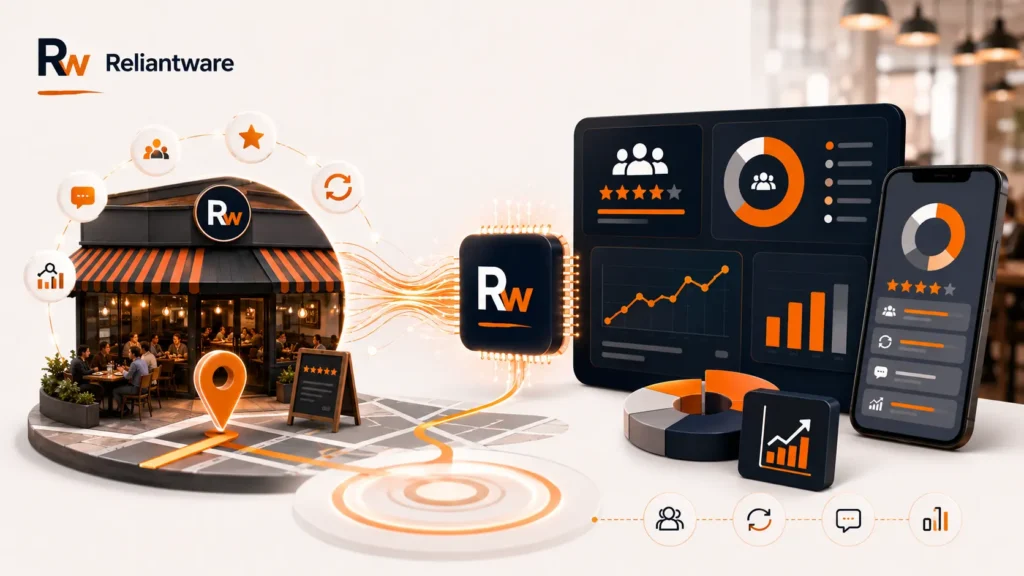
Customer analytics for restaurants connects POS, loyalty, reservation, and review data into one guest picture. Seven metrics matter: retention and repeat purchase rate for loyalty, AOV and CLV for guest worth, NPS and redemption rate for satisfaction and offers. For example, 45 dollar average order, six visits yearly, three years equals 810 dollars lifetime value, no software needed. Catch churn with a win back offer after 45 days silent, and sort menu items into stars, workhorses, puzzles, and dogs for a clear action on each.
No enterprise software required until multiple locations. Retention and review signals also drive local search recommendations, the exact intersection Reliantware built its restaurant SEO approach around.
Key Takeaways
- Customer analytics means connecting POS, loyalty, reservation, and review data into one guest picture, not treating each as a silo
- Seven metrics cover it all: retention rate, repeat purchase rate, AOV, CLV, NPS, redemption rate, and visit frequency
- CLV is simple math (AOV × visits per year × years), no software required to calculate it
- A win back offer after 45 days of silence catches churn before it becomes permanent
- Menu items sort into stars, workhorses, puzzles, and dogs, each with a specific next action
- Enterprise software only becomes necessary once you’re managing multiple locations
- Retention and review signals double as local search ranking signals, which is the exact gap Reliantware built its restaurant SEO strategy around
What Is Customer Analytics for Restaurants?
Customer analytics for restaurants is all about understanding your guests. It looks at who visits, how often they come back, what they order, and how they feel about their experience. Unlike broader restaurant analytics, which also tracks things like staffing and inventory, customer analytics focuses specifically on guest behavior. Those insights help restaurants make smarter decisions about marketing, menu offerings, and customer retention.
That distinction matters. A restaurant can be operationally efficient, tight labor costs, low food waste, and still lose money because repeat guests are quietly drifting away. Customer analytics is the layer built to catch that before it shows up on the revenue line. In our experience at Reliantware, the restaurants that treat this as a distinct discipline, not just a subset of general reporting, are the ones that spot problems weeks before the sales numbers confirm them.
The Core Data Sources Feeding Your Customer Analytics
You don’t need new technology to start. You need to look at what your current systems are already recording.
POS and Order Data
Your point of sale tracks every transaction, order size, item mix, time of visit. This is the foundation. It tells you what customers buy and when, but not who they are unless it’s linked to a loyalty account.
Loyalty and CRM Data
A loyalty program or CRM adds identity to the transaction. Enrollment rates, redemption frequency, and repeat visit patterns come from here. This is where you start seeing individual guests instead of anonymous transactions.
Reservations and Reviews
Reservation systems reveal party size trends, no show rates, and booking lead times. Reviews add sentiment, what guests actually think, not just what they bought. Pull these three together and you get a genuinely complete picture instead of three partial ones.
The Customer Analytics Metrics That Actually Matter
Most restaurants track too much or too little. Here are the seven that consistently correlate with revenue health.
Metric | Formula | Why It Matters |
Customer Retention Rate | Repeat guests ÷ Total unique guests × 100 | Shows how many guests actually come back |
Customer Lifetime Value | AOV × Visit frequency × Average lifespan | Tells you what a guest is worth over time |
Average Order Value | Total revenue ÷ Total orders | Flags upsell and pricing opportunities |
Visit Frequency | Total visits ÷ Unique guests over a period | Reveals how often loyal guests actually return |
Repeat Purchase Rate | Returning buyers ÷ Total buyers | A tighter lens on true loyalty versus one time traffic |
Net Promoter Score | Survey based, promoters minus detractors | Predicts word of mouth growth before it happens |
Redemption Rate | Offers redeemed ÷ Offers sent | Measures whether your promotions are landing |
Pick three or four to start. Trying to track all seven from day one usually means none of them get checked consistently.
How to Calculate Customer Lifetime Value for a Restaurant
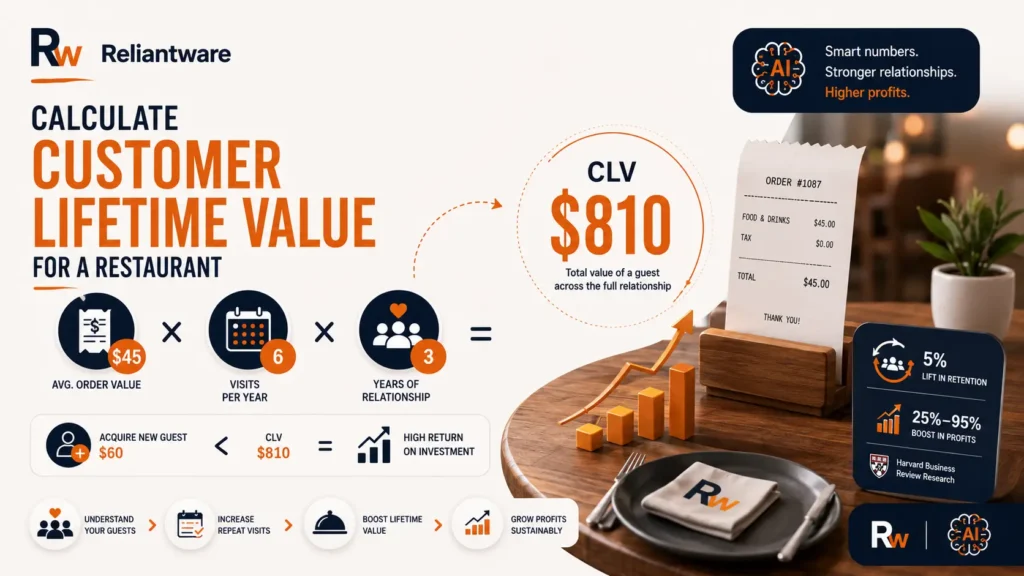
CLV is the metric owners ask about most and calculate least, mostly because it sounds more complicated than it is.
Take a guest with an average order value of 45 dollars, visiting six times a year, over an estimated three year relationship with your restaurant. Multiply those three numbers: 45 times 6 times 3 equals 810 dollars. That’s what this guest is worth to you, not per visit, but across the full relationship.
Once you know that number, marketing spend decisions get easier. Harvard Business Review research shows a 5 percent lift in retention can boost profits 25 to 95 percent. If acquiring a new guest costs 60 dollars and their lifetime value is 810, that spend is justified many times over.
Using Customer Analytics to Reduce Guest Churn
Churn is the guest who used to visit every two weeks and simply stopped. Most restaurants don’t notice until months later, if at all.
A basic win back trigger works well here. If a guest who normally visits every 14 days hasn’t returned in 45, an automated offer goes out. This single tactic recovers a meaningful share of lapsed guests in most loyalty programs, often somewhere around 10 to 15 percent, without requiring a broad discount to your entire list.
Milestone offers, such as birthday and anniversary messages sent a week in advance, often bring in larger groups than a typical promotion. The lesson is simple: personalized, well-timed offers consistently outperform generic discounts that run all the time.
Menu Engineering: Turning Order Data Into Profit
Once you have order data connected to profitability by item, you can sort your menu into four categories. This is the clearest decision framework customer analytics gives you.
Stars are your winners, so keep them consistent and give them prime placement on the menu. Workhorses are crowd favorites with thinner margins, making them good candidates for a careful price or portion review. Puzzles deliver strong profits but don’t get ordered enough, so highlight them through menu design and server recommendations. Dogs struggle on both popularity and profit, and in many cases the best decision is to remove them instead of keeping them around out of habit.
The value here isn’t the categorization itself. It’s that each quadrant tells you a specific next action, not just a status report.
Customer Analytics Without Enterprise Software
You don’t need a data warehouse to start this. A spreadsheet pulling weekly exports from your POS and loyalty system covers the first several months of this work for most independent restaurants.
The honest limitation is this: manual tracking works well up to a point, usually a single location or a very small handful of them.Spreadsheets work well in the early stages, but once you’re managing multiple locations, comparing performance across stores, or triggering win-back campaigns in real time, they often become the bottleneck instead of the solution. That’s when dedicated analytics and automation tools start saving time and uncovering insights you might otherwise miss. At that stage, a dedicated platform earns its cost. Before that stage, it often doesn’t.
How Customer Analytics Connects to Local Search Visibility
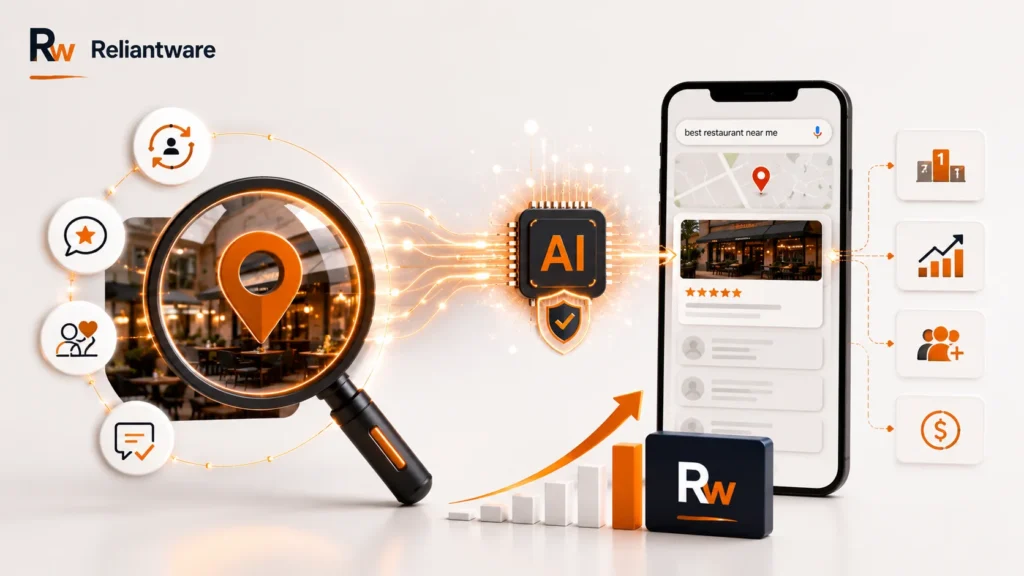
Here’s the piece most guides on this topic miss entirely. The same signals that make up your customer analytics, retention, reviews, repeat visits, are also what search engines and AI tools weigh when deciding which restaurant to recommend for a nearby search.
A restaurant with strong review volume, consistent response rates, and healthy retention sends a trust signal that extends beyond the guests who already know you. It’s the difference between showing up in a local pack search and getting skipped for a competitor with a thinner track record but louder online presence. Customer analytics tells you where you stand with existing guests. Visibility work determines whether new guests ever get the chance to become one. See how Reliantware helps restaurants turn customer analytics into local search growth. Get a free audit at Reliantware and discover what’s holding your restaurant back from ranking, getting found, and winning more diners.
Common Mistakes to Avoid
Restaurants make a handful of the same mistakes repeatedly.
- Tracking POS, loyalty, and review data in three separate silos instead of connecting them
- Building real time dashboards that nobody actually opens between shifts
- Treating review sentiment as a reputation task instead of an early revenue signal
- Sending one generic discount blast to the entire list instead of behavior triggered offers
- Running the menu engineering exercise once and never revisiting it as costs shift
How to Start Tracking Customer Analytics This Month
Start small and build from there.
Pull your last 90 days of POS data and calculate your current retention rate. Layer in loyalty program exports if you have one, and note how many guests haven’t returned in 45 days or more. Set a recurring 20 minute weekly review, not monthly, to catch churn signals while they’re still fixable. Pick one metric to act on first, most owners start with retention rate since it’s the simplest to influence quickly. Once that rhythm feels normal, add CLV and menu profitability into the mix.
Conclusion
Customer analytics for restaurants isn’t a software category, it’s a habit of paying attention to the guests who already trust you enough to walk through the door. The restaurants that build this habit catch problems early and turn repeat guests into their most reliable revenue source. And since the same signals that build guest loyalty also shape how visible you are to new customers searching nearby, this work rarely stays contained to retention alone. See how Reliantware helps restaurants dominate local search, Get a free audit at Reliantware today.
FAQs
What is customer analytics in a restaurant?
Collecting and analyzing guest data, orders, visits, spending, feedback, to understand behavior and guide decisions.
Why is customer analytics important for restaurants?
Identifies best customers, improves retention, personalizes marketing, and reduces churn to increase revenue.
What data should restaurants track for customer analytics?
Purchase history, AOV, visit frequency, CLV, loyalty activity, online orders, reservations, and feedback.
How can customer analytics increase restaurant sales?
Targets promotions to the right guests, encourages repeat visits, and cuts wasted marketing spend.
What are the most important restaurant customer analytics metrics?
Retention rate, repeat purchase rate, CLV, AOV, visit frequency, churn rate, redemption rate, satisfaction scores.
How do loyalty programs help with customer analytics?
Reveals visit patterns, spending, and favorite items, enabling personalized offers and stronger relationships.
What tools are used for restaurant customer analytics?
POS, CRM, loyalty software, online ordering, reservation systems, and BI tools like Toast, Square, SevenRooms.
How can small restaurants start using customer analytics?
Track repeat customers, average spend, and feedback through existing POS and loyalty systems.
Empty Tables Cost You $4,000+/Month. Filling Them Costs $0 in Ads.
Hungry diners search Google every night. Show up there, and they come to you.
Free.
Claim your Roadmap now. No obligation